April 2025
In my previous article Retrospective: The LimCon HyperCard Stack I wrote about a project I worked on back when I was a student at The College of Wooster, a HyperCard stack called LimCon, designed to teach topics from basic calculus. I have written about the design and implementation of the XCMD I wrote for that project, called graphPack, in two articles, Talking Back to HyperCard and Talking Back to HyperCard Revisited. In the latter article, I discuss how I improved the the simplified, stripped-down version of graphPack from my original Talking Back to HyperCard article.
After finishing that work, with my development tools fully up and running on an emulated Macintosh, with a much larger screen, with many times the memory, processing power and storage space I had back in the day, I realized I could go ahead and scratch some personal itches, and fix some of the deficiencies in the original implementation. This article discusses that process and the results.
Back when I wrote it, I was aware that I had not been able to get the graphs working quite as well as I wanted to. The grid seemed to be slightly off, despite my best efforts at fixing it. In addition, it seemed like the rounding of the coordinates to QuickDraw point values wasn’t quite right. I was aware of these deficiencies, but I was pressed for time — I had to finish my senior independent study project, along with my other classes, and graduate! So I made the lines two pixels wide instead of one, which made the misalignment less noticeable.
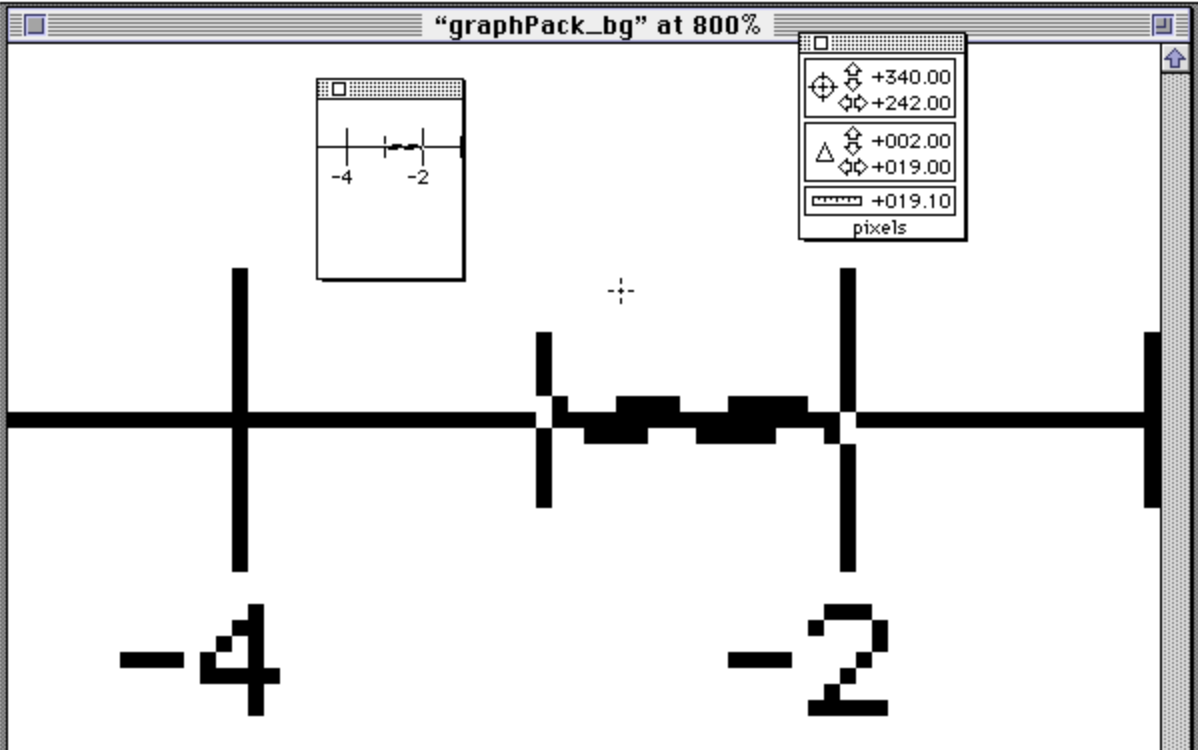
The first thing to do was to fix the PICT that I use as a backdrop. I used MacPaint zoomed in to the maximum to count pixels between grid marks and realized that, yes, there were some off-by-one-pixel errors in aligning grid marks. So I painstakingly fixed things up:

I was reminded again just how amazing MacPaint was, and still is, and how productive it is to be able to select parts of an image with the selection tool, copy them, paste them into the scrapbook desk accessory, and then, later, paste them into ResEdit. 35 years later I can edit PNG files using GIMP, or Apple’s Preview application, but their user interfaces are not as simple and refined as MacPaint’s. Bill Atkinson’s achievement in efficient software design — developing QuickDraw, MacPaint, and HyperCard — remains unparalleled!
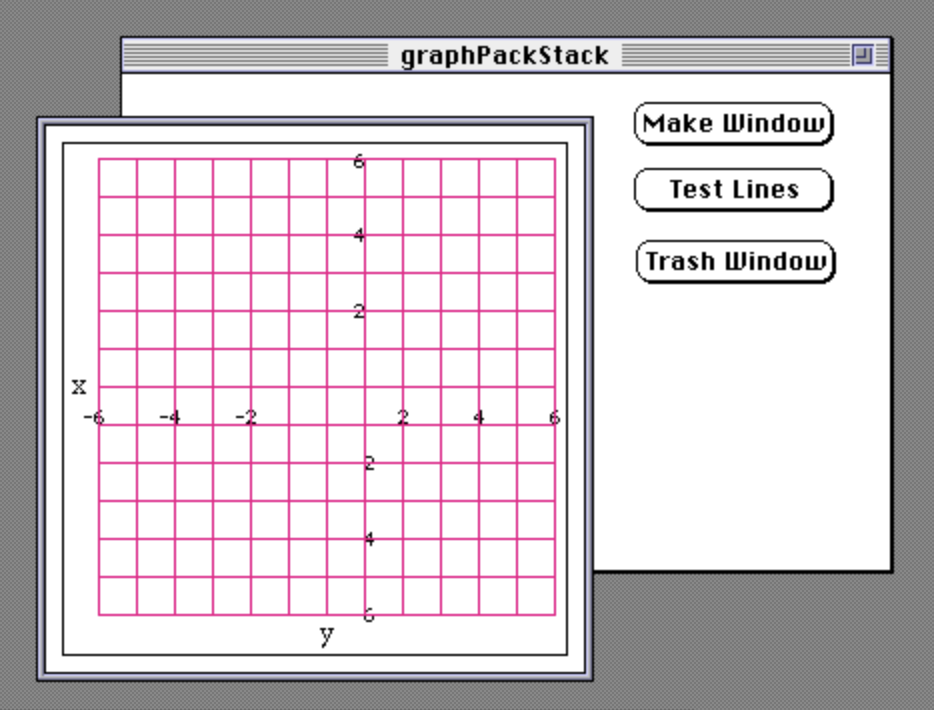
After fixing these alignment issues, I found that if I asked graphPack to draw lines using whole numbers from -6 to 6 on the graph, they would line up precisely on the grid, drawing completely over the black grid lines:
Once I had lines at whole number coördinates lined up correctly on the background image, I could start testing lines at non-integral coördinates. This tests rounding. My first attempt drew lines from (-6, -5.5) to (6, -5.5), etc. When I looked closely, you I saw that the alignment with the background image wasn’t consistent:
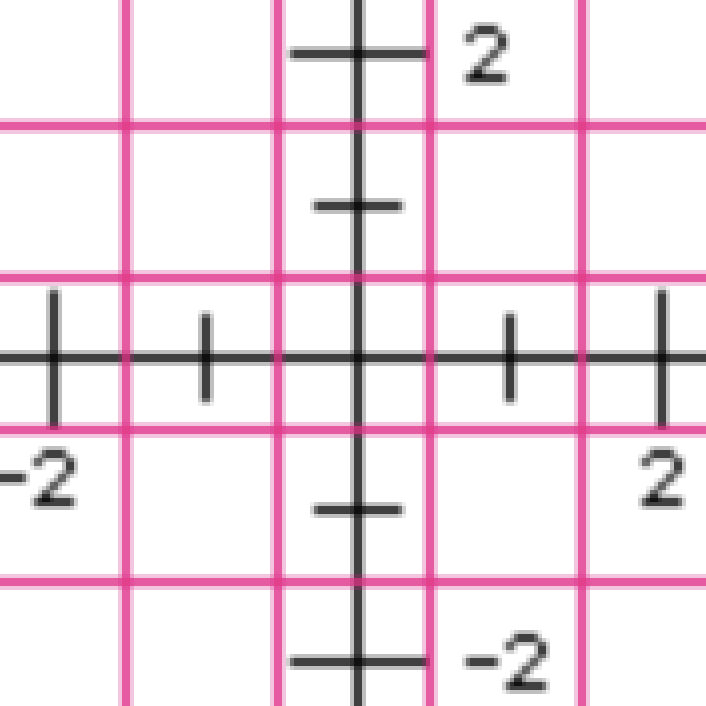
It turns out that lines drawn at negative coordinates (up and to the left from the center, the origin) are one pixel further away from the origin than lines drawn with positive coordinates. (Keep in mind that in Apple’s QuickTime drawing system, y-coordinates are backwards when compared to the traditional Cartesian coordinates, and y-coordinates above the x-axis are negative, not positive).
Why are they off? Let’s take a look at the code. When scaling and shifting coordinates on the abstract x-coordinate plane in the range [-6..6], the original code does this:
return (short)(x_d * X_SCALE + X_CENTER);Note that our X_SCALE value is 19 — 19 pixels correspond to 1 unit on our Cartesian plane — and our X_CENTER is 136.
We can think of this as a pipeline: the double x values are scaled up, translated, then converted to to short type by casting, which just truncates the fractional part. Here is a set of Cartesian x-values showing how they are converted to QuickDraw x-coördinates, where the center of our background image is the pixel below and to the right of QuickDraw’s abstract grid point x = 136; we want this point to correspond to our y-axis.
| x-value | scaled | translated | cast to short | distance from x=136 |
|---|---|---|---|---|
| -1.5 | -28.5 | 107.5 | 107 | 29 |
| -0.5 | -9.5 | 126.5 | 126 | 10 |
| 0.5 | 9.5 | 145.5 | 145 | 9 |
| 1.5 | 28.5 | 164.5 | 164 | 28 |
Taking a look at the last column, we can see that the distances from the center point (the absolute values of the short value - 136) differ in the negative and positive directions.
We could use the common low-cost rounding trick of adding adding 0.5 to the floating-point value before casting (truncating) the value:
return (short)(x_d * X_SCALE + X_CENTER + 0.5F);Now we get:
| x-value | scaled | translated | + 0.5 | cast to short | distance from center |
|---|---|---|---|---|---|
| -1.5 | -28.5 | 107.5 | 108 | 107 | 28 |
| -0.5 | -9.5 | 126.5 | 127 | 127 | 9 |
| 0.5 | 9.5 | 145.5 | 146 | 146 | 10 |
| 1.5 | 28.5 | 164.5 | 165 | 165 | 29 |
But doesn’t fix the symmetry problem across the y-axis! If we were working only in the first quadrant, this approach would work fine; the points at 0.5, 1.5, 2.5, 3.5, etc. would be spaced evenly from each other:
| x-value | scaled | translated | + 0.5 | cast to short | distance from previous |
|---|---|---|---|---|---|
| 0.5 | 9.5 | 145.5 | 184 | 146 | n/a |
| 1.5 | 28.5 | 164.5 | 165 | 165 | 19 |
| 2.5 | 47.5 | 183.5 | 184 | 184 | 19 |
What we really need to do add 0.5 only if our abstract coordinate is positive, so that we round symmetrically across the axes. In other words, we want the math for negative values to work out like this:
| x-value | scaled | translated | cast to short | distance to next |
|---|---|---|---|---|
| -2.5 | -47.5 | 88.5 | 88 | 19 |
| -1.5 | -28.5 | 107.5 | 107 | 19 |
| -0.5 | -9.5 | 126.6 | 126 | n/a |
So let’s try it:
double x_d = paramToDouble(paramPtr, cstr);
short  x_s = (short)X_CENTER;

if (x_d < 0.0F)
{
    x_s += (short)(x_d * X_SCALE);
}
else if (x_d > 0.0F)
{
    x_s += (short)(x_d * X_SCALE + 0.5F);
}
Note that this is for the x-dimension only. For the y-dimension, we have a slight complication; we need to account for QuickDraw’s non-standard coordinate system. In standard Cartesian coordinates, coordinates above the x-axis have positive y-values, and coordinates below the x-axis have negative y-values. We can do this by simply subtracting, rather than adding, the scaled, translated, and tweaked coördinate values after casting:
double y_d = paramToDouble(paramPtr, cstr);
short  y_s = (short)Y_CENTER;

if (y_d < 0.0F)
{
    y_s -= (short)(y_d * Y_SCALE);
}
else if (y_d > 0.0F)
{
    x_s -= (short)(y_d * Y_SCALE + 0.5F);
}
This gets us really close to perfection — but not quite!

The distances between plus and minus 1.5, 2.5, 3.5, etc. are correct now in all directions. But if we zoom really close, we note that the half-value grid is not perfectly centered around the origin. What this really means is that the points in the half-value grid are not spaced correctly with respect to their adjacent points in the whole-value grid.
Let’s look at the eight points at x and y values of -1.0, -0.5, 0.5, and 1.0 around the origin, and the absolute values of their distance from the origin in QuickDraw coordinates after scaling:
| Cartesian x | Cartesian y | QuickDraw distance x | QuickDraw distance y |
|---|---|---|---|
| 0.5 | 0.5 | 9 | 10 |
| 1.0 | 1.0 | 19 | 19 |
| -0.5 | 0.5 | 10 | 10 |
| -1.0 | 1.0 | 19 | 19 |
| -0.5 | -0.5 | 10 | 9 |
| -1.0 | -1.0 | 19 | 19 |
| 0.5 | -0.5 | 9 | 9 |
| 1.0 | -1.0 | 19 | 19 |
Note that our distance values for positive 0.5 x-values are 9, and for negative 0.5 x-values are 10. With the y-axis flipped over, our distance values for negative 0.5 y-values are 9, and for positive 0.5 x-values are 10.
Is the problem clear now? We have an issue with the way that rounding error is distributed. When we scale our 19-pixel scale factor by a whole value, everything works fine. When we scale it by a half value, we have a half value that we have to round one way or the other. Because we’re dividing an odd number, 19, in half, There’s no “middle value” corresponding to a pixel. If we round up, the resulting pixels on the graph will be one pixel too close to the next whole number. If we round down, the resulting pixel on the graph will be one pixel too close to the previous whole number.
We could fix this half-value problem by stretching our whole graph so that our scale factor is 20 pixels, not 19. But this would mean that our window would no longer fit into the space it was designed to fit into, right on top of a blank space on certain cards in the original HyperCard stack, running in 640x480. So let’s not do that. And we can’t fix the general problem that way; 20 is not evenly divisible by 3.
Instead, let’s just round away from the origin in both directions so that the distances from the origin are symmetrical. I can do this by subtracting scaled, translated negative values before truncating them:
if (x_d < 0.0F)
{
    x_s += (short)(x_d * X_SCALE - 0.5F);
}
and
if (y_d < 0.0F)
{
    y_s -= (short)(y_d * Y_SCALE - 0.5F);
}
When I do this, the half values and whole values follow a symmetrical pattern when moving away from the origin, alternating between 9 and 10 pixels apart: 10 pixels from the origin to the first half value, 9 pixels from the first half value to the first whole value, 9 pixels from the first whole value to the second whole value, etc.
This behavior, by the way, is what I’d expect from the standard C math function round(), defined in <math.h>. Couldn’t I just use that function? No — that function was added to C in the 1999 version of the standard, and it isn’t part of THINK C. We could do this using ceil() and floor() in the negative and positive branches, but it really isn’t necessary.
Next, let’s verify that we have good alignment on our points, arrows, and arrowheads, as I was never quite satisfied with these originally. Here’s the original code behavior:
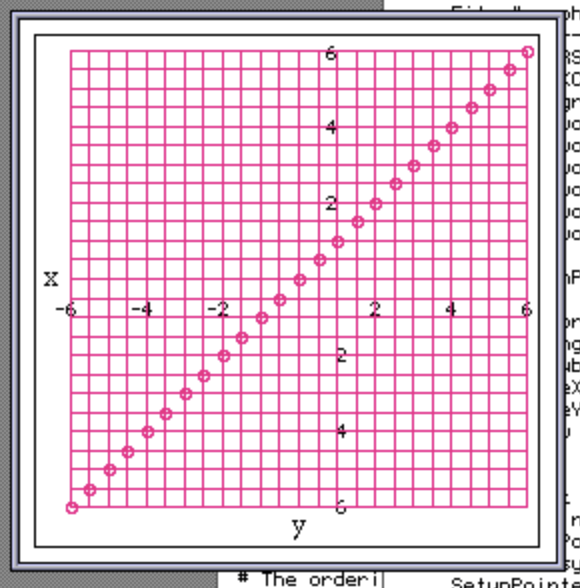
Notice how the hollow circles are not perfectly centered on the points where the lines cross. What’s the problem?
The problem is really very simple: the center point of our small circle, four QuickDraw points wide, does not correspond to a pixel on the screen. Instead, it corresponds to a zero-width, zero-height abstract point in QuickDraw’s coordinate plane.
The solution is equally simple: if we want to draw a circle that appears correctly centered around a pixel on the screen, the circle must be an odd number of pixels in diameter, so that there can be a pixel centered in the middle. While we’re at it, let’s make the circles a bit bigger. Let’s set the radius to 3 instead of 2, and then draw the rectangle that QuickDraw uses to define the circle asymmetrically so that the actual radius, measured from the center point in the circle to the center point of the pixels of the circle, is 3.5. (Keep in mind that the distance will be approximate at some points, due to the stair-stepped nature of the pixel grid.)
This results in code to define the rectangle data structure used to draw the circles that looks like this:
#define CIRC_RADIUS 3

/*
    Note: SetRect takes top left x, y, bottom right x, y

    To get the best visual pixel alignment when we draw these right
    on a line or an axis, we need to give them odd diameter.
*/
SetRect(&theRect, (x - CIRC_RADIUS),
                  (y - CIRC_RADIUS),
                  (x + CIRC_RADIUS + 1),
                  (y + CIRC_RADIUS + 1));
But wait — shouldn’t we be shifting the top left point up and left, rather than the bottom right point down and right? No, because the point we’re centering the circle around has been drawn below and to the right of our abstract QuickDraw coordinates. It makes sense if you draw it on graph paper and fill in the squares. Here’s a close-up view of the slightly larger, correctly-aligned circles on the grid:

Incidentally, not long after I worked on graphPack, I was a beta-tester for a new program for IBM-compatible PCs called Microsoft Windows 3.0, which included a MacPaint knock-off called Paint. I was appalled to find out that the drawing tools, including the selection tool, were full of off-by-one errors, when compared to the originals; it was almost impossible to select, cut, copy, and paste exactly the pixels I wanted. I was horrified by the lack of consistency and attention to detail in this new graphical user interface, and submitted some bug reports to Microsoft. But that’s a story for another day.
I next checked the large pointer arrows used for pointing out features of the graphs. Here are horizontal arrows:
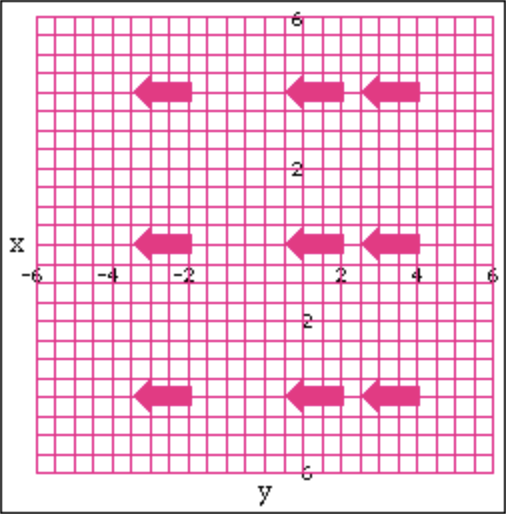
Not surprisingly, these have the same off-by-one problem as the circles: if we want them to be able to point directly at a pixel, not a point, they need to be an odd number of pixels tall. The vertical version has a similar problem. The corrected code to draw the polygons now looks like this:
switch (rotation)
{
    case 0:
        /* Points from the right */
        x += 10;
        MoveTo(x, y);
        LineTo(x + 10, y - 9);
        LineTo(x + 10, y - 4);
        LineTo(x + 30, y - 4);
        LineTo(x + 30, y + 5);
        LineTo(x + 10, y + 5);
        LineTo(x + 10, y + 10);
        LineTo(x, y);
        break;

    case 0:
        /* Points from below */
        y += 5;
        MoveTo(x, y);
        LineTo(x + 10, y + 10);
        LineTo(x + 5,  y + 10);
        LineTo(x + 5,  y + 30);
        LineTo(x - 4,  y + 30);
        LineTo(x - 4,  y + 10);
        LineTo(x - 9,  y + 10);
        LineTo(x, y);
        break;
}
The arrowheads are next. I was really never quite happy with these in the original code. I spent a little time experimenting with different values for the arc size in degrees, bounding box size, and alignment of the bounding box on the grid. This is the the best I could get, tested by drawing arrowheads pointing at the center points of hollow circles, at angles that are multples of 45, 30, and 15:
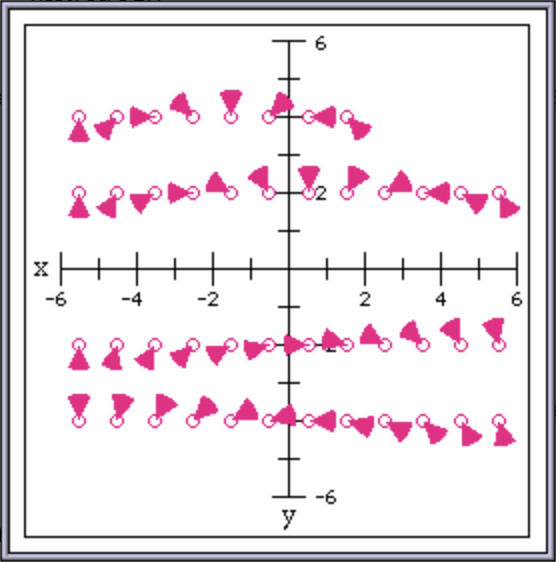
These arrowheads look a bit better; I don’t think I can get them to look any better, short of drawing the arrows by hand at all those rotations and loading them from PICT resources. That seems like a lot of work for very marginal return, so, I’ll stop there.
There are two more things left to check: the vertical and horizontal asymptotes. I tweaked these to use a 1-pixel pen, to match the changes I made to other commands. The result looks like this:
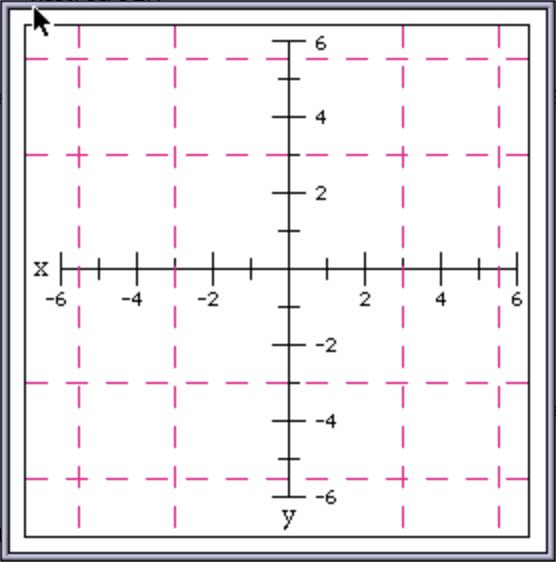
The next thing I needed to do was to put the updated graphPack XCMD code resource into a copy of the original LimCon stack and test it. The original graphs were OK — they did the job — but I never was able to get them to look quite as nice and precise as I wanted, 35 years ago. They look nicer with the updated graphPack! In other words, I have finally succeeded at scratching that 35-year-old itch.
Here’s a little gallery of graphs to show off all the features of graphPack — missing points, removable points, asymptotes, arrowheads, and large pointer arrows, to graph functions defined with missing point and removable point discontinuities, piecewise definitions, and asymptotes:
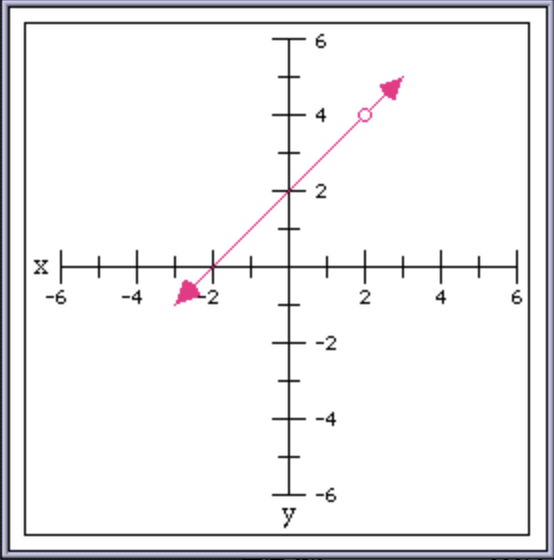
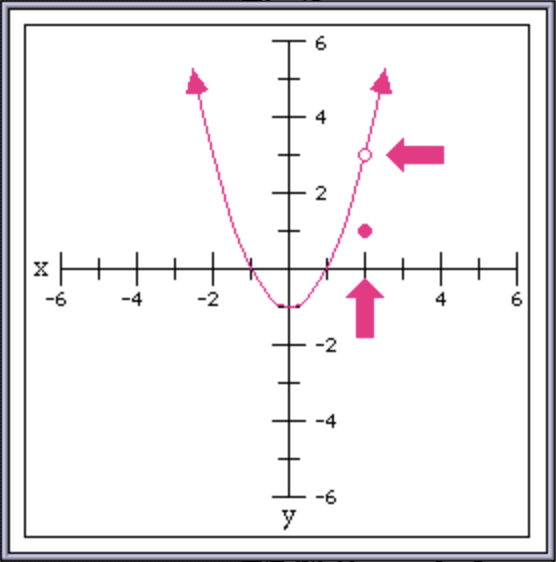
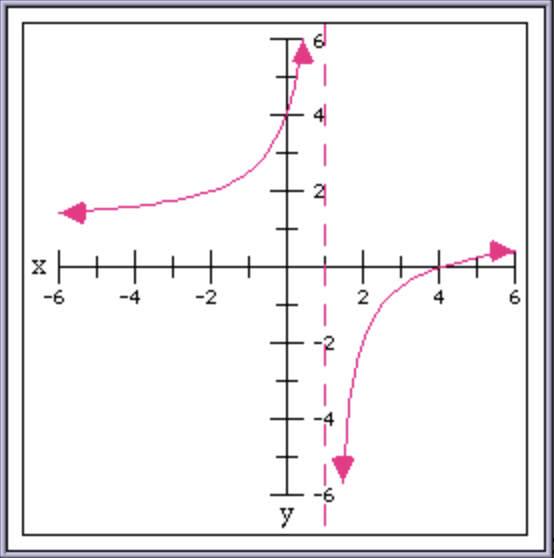
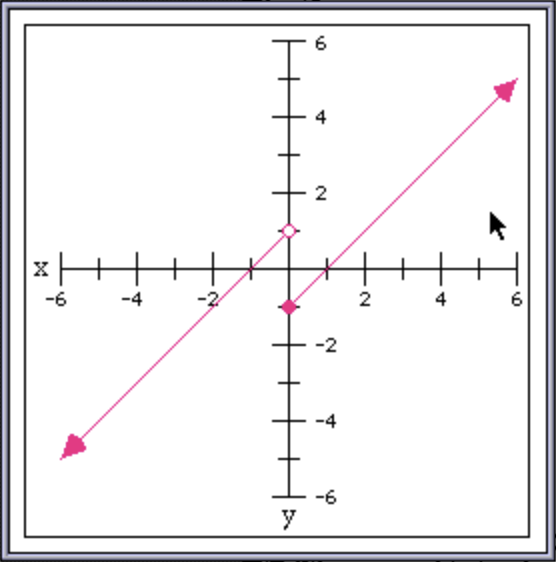
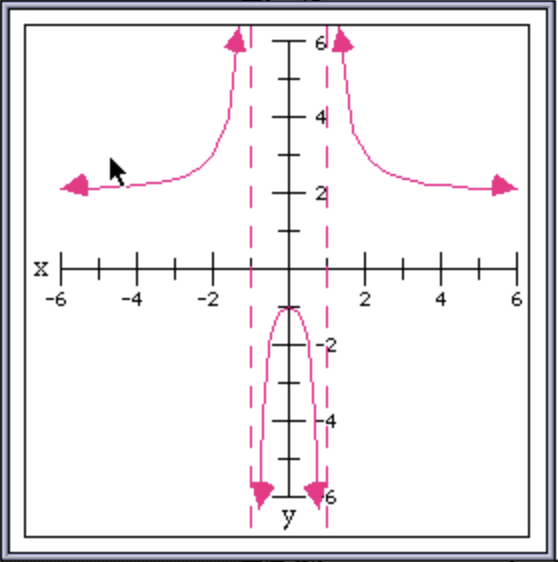
The only thing still a little bit off are the arrowheads — they aren’t pointing at exactly the angle I’d like. But that is actually due to values in the LimCon HyperCard stack itself that are a bit off. Maybe I’ll look at improving the HyperTalk code that draws these graphs another time. But for now I’m satisfied with my improvements to graphPack.
I’ve made it seem like the process of getting the full version of graphPack building and running, built with THINK C 5, was straightforward. It was not. To get it working correctly, I had to switch from using THINK C 5 to using MPW (Macintosh Programmer’s Workshop).
After getting it working, I went back and tried to determine exactly why THINK C 5 could not build working code, while earlier versions could, and MPW could. In the process of documenting my research, this article continued to grow, and became a katamari of Macintosh programming, as I wound up rolling extracts from old documentation, explanations of how Apple’s SANE numerics library works, the calling conventions for C code on the Macintosh, how the mechanism to call back into HyperCard worked across different versions of the THINK C toolchain, and lots and lots of disassembled code. And I’m still not done, because I haven’t really solved it!
So to avoid continually revising this article, and publishing intermediate, half-baked versions, I’ve decided to break that out into a separate, future technical deep dive article, which I’ll publish only after I’m satisifed that I’ve figured out the root causes.
Keep the vision of old Macintosh programming alive!
As always, this content is available for your use under a Creative Commons Attribution-NonCommercial 4.0 International License.